
What are support and resistance in forex?
Understand support and resistance zones, historical reactions, timeframe differences, breakouts, and false breaks on forex charts.
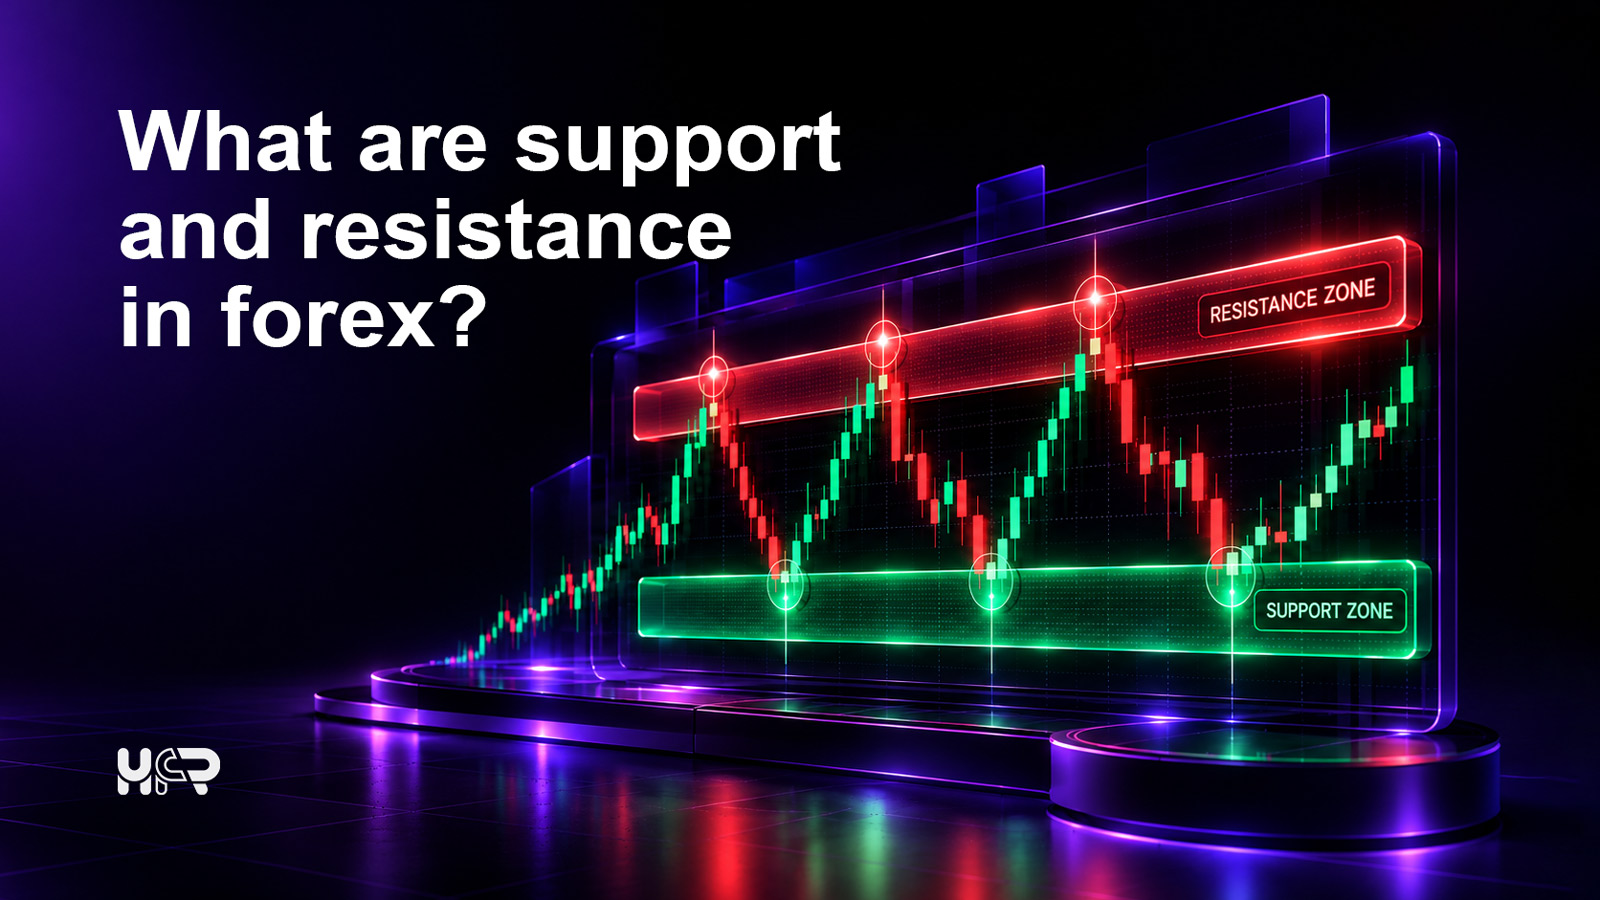
Support and resistance in forex are chart areas where price has previously slowed, paused or changed direction. Support is often below the current price, where a decline previously lost momentum or reversed. Resistance is often above it, where an advance previously stalled. The same area may change its role after price moves through it.
These areas are based on historical price behaviour. They do not guarantee that price will react the same way again. A support zone can break, a resistance zone can fail, and a brief move through either area can reverse quickly. The useful purpose of support and resistance is to organise chart context, not to predict the next move with certainty.
Support and resistance are also better treated as zones than as exact prices. Markets often turn slightly above, below or through a previously watched level, especially when volatility changes. The timeframe, instrument and chart history used can also change which areas appear important.
How support and resistance work in forex
A support area is a price region where a decline previously slowed, paused or reversed. A resistance area is a price region where an advance previously slowed, paused, or reversed. Technical analysts use those past reactions as reference points when describing current market structure.
The important word is previously. A chart records a past reaction; it cannot prove that buyers or sellers will behave the same way next time. Treat these as potential areas of interest rather than fixed barriers.
Support versus resistance: what is the difference?
Concept | Typical location | What the chart shows |
|---|---|---|
Support | Often below current price | Price previously stopped falling, paused or moved higher in the area. |
Resistance | Often above current price | Price previously stopped rising, paused or moved lower in the area. |
This distinction is descriptive rather than predictive. A support zone does not mean price must rise from it, and a resistance zone does not mean price must fall from it.
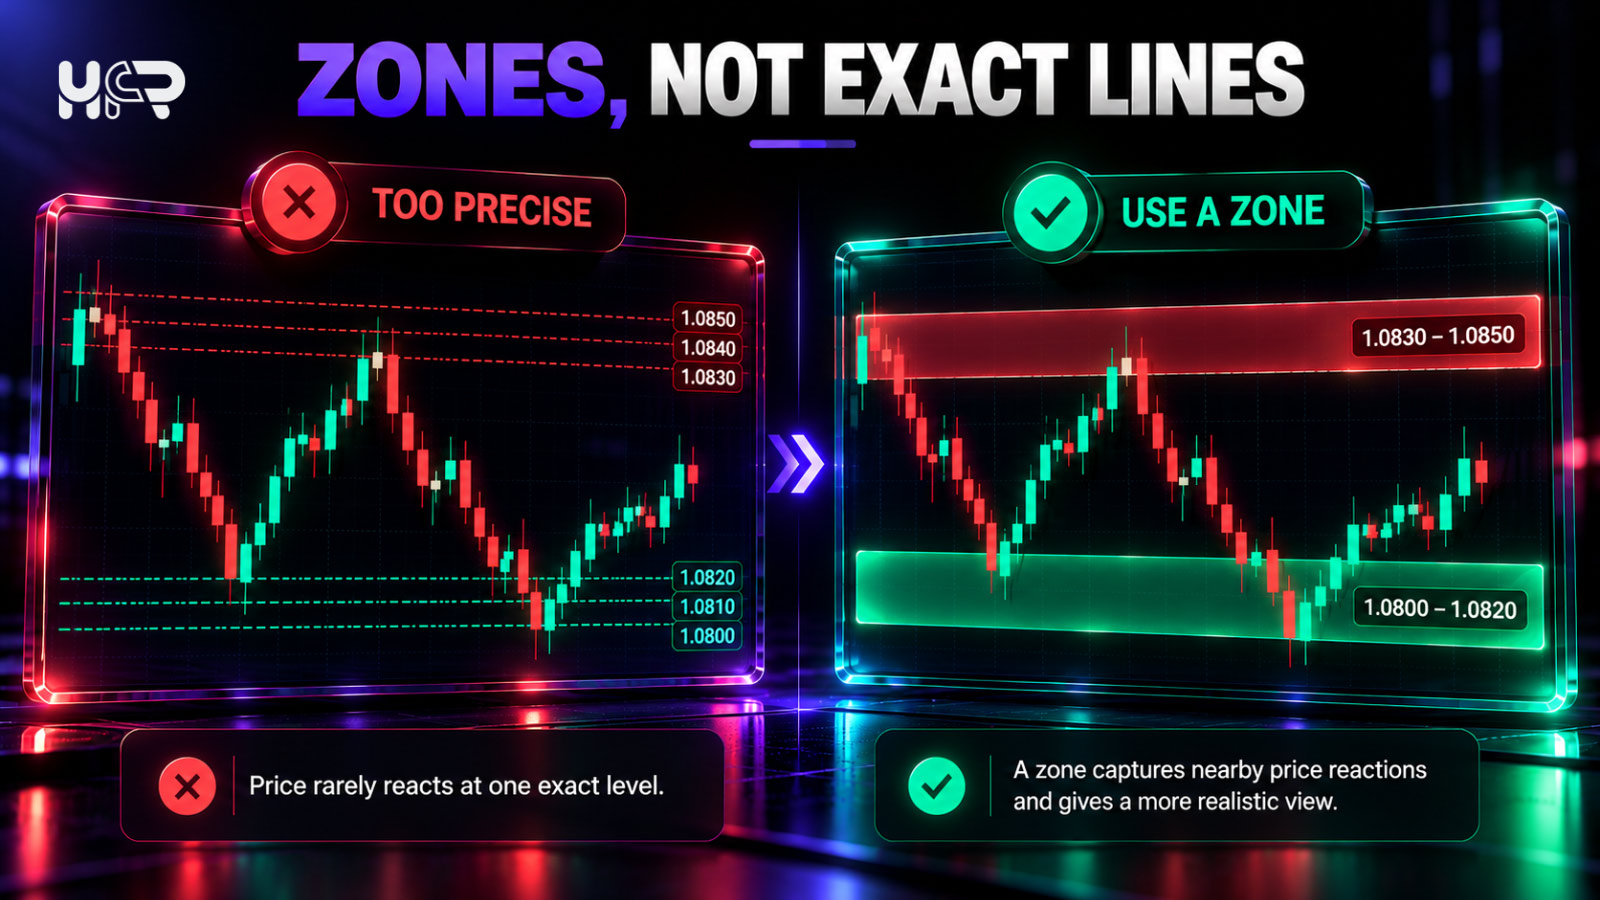
Why are support and resistance usually zones, not exact prices?
Major support and resistance areas are rarely exact figures. Price can stop short of a former turning point, move briefly through it or leave a wick beyond the area before returning. IG Academy therefore recommends thinking of major support and resistance as zones rather than single precise prices.
A zone groups nearby historical reactions into one area. For example, if EUR/USD repeatedly turns between 1.0820 and 1.0840, drawing one broad support zone can describe the chart more accurately than drawing several separate lines at 1.0823, 1.0831 and 1.0838.
How wide should a support or resistance zone be?
There is no universal number of pips for zone width. The appropriate width depends on the instrument, timeframe, volatility, and how closely the historical reactions cluster. A zone should be wide enough to represent the repeated price behaviour without becoming so broad that it loses meaning.
How do support and resistance areas form on a forex chart?
The simplest support and resistance areas come from visible swing points. A swing low is a local low followed by a move higher; a swing high is a local high followed by a move lower. When several swing lows occur in the same general area, that region may be marked as potential support. Repeated swing highs in a similar area may form potential resistance.
Historical turning areas are useful because they are observable. They show where price changed behaviour before. They do not reveal the exact cause of that change or guarantee that the same reaction will repeat.
Traditional technical analysis often explains support and resistance through shifts in supply, demand and market psychology. However, the chart itself only confirms that price reacted in an area; it does not reveal the exact orders or intentions that caused the move.
Repeated reactions around the same area
Several reactions around the same area can make a zone easier to identify than a level based on one touch. However, repeated tests do not establish that the next reaction will hold or that the level is becoming stronger.
How does timeframe change support and resistance?
Support and resistance are always tied to the timeframe being analysed. A daily chart can show a broad zone built from reactions over several weeks, while a 15-minute chart inside the same area may contain many smaller swings and short-lived levels.
A higher timeframe shows price behaviour over a longer period and can provide broader context. A lower timeframe reveals smaller moves and more short-term noise. Neither automatically makes a zone valid or invalid; they describe the market at different scales.
This is also why two traders can mark different levels on the same currency pair without one of them necessarily being wrong. They may be using different timeframes or different historical windows.
How to mark support and resistance on a forex chart
Start with the clearest historical turning areas rather than marking every minor move. The purpose is to organise the chart, not to fill it with lines.
Start with obvious swing areas. Look for clear highs and lows where price changed direction or paused noticeably.
Group nearby reactions into zones. If several turning points are close together, one zone often describes them better than multiple exact lines.
Check a broader timeframe. A higher timeframe can show whether a short-term level sits inside a larger area of historical interest.
Keep the chart selective. Remove old or minor levels that no longer help explain current price structure.
Describe, do not predict. Mark what the chart has shown and avoid assuming the next reaction is already known.
A worked example: marking support and resistance on EUR/USD
Imagine a hypothetical EUR/USD chart where price falls into the 1.0820-1.0840 area several times and later moves higher. The chart also shows several advances stalling between 1.0980 and 1.1000.
Observed area | Possible label | Reason |
|---|---|---|
1.0820–1.0840 | Potential support zone | Several lower reactions occurred in the same general area. |
1.0980–1.1000 | Potential resistance zone | Several upper reactions stalled in the same general area. |
This example shows how historical reactions can be grouped into zones. It does not predict that EUR/USD will bounce from support or fall from resistance when the areas are reached again.
What happens when support or resistance breaks?
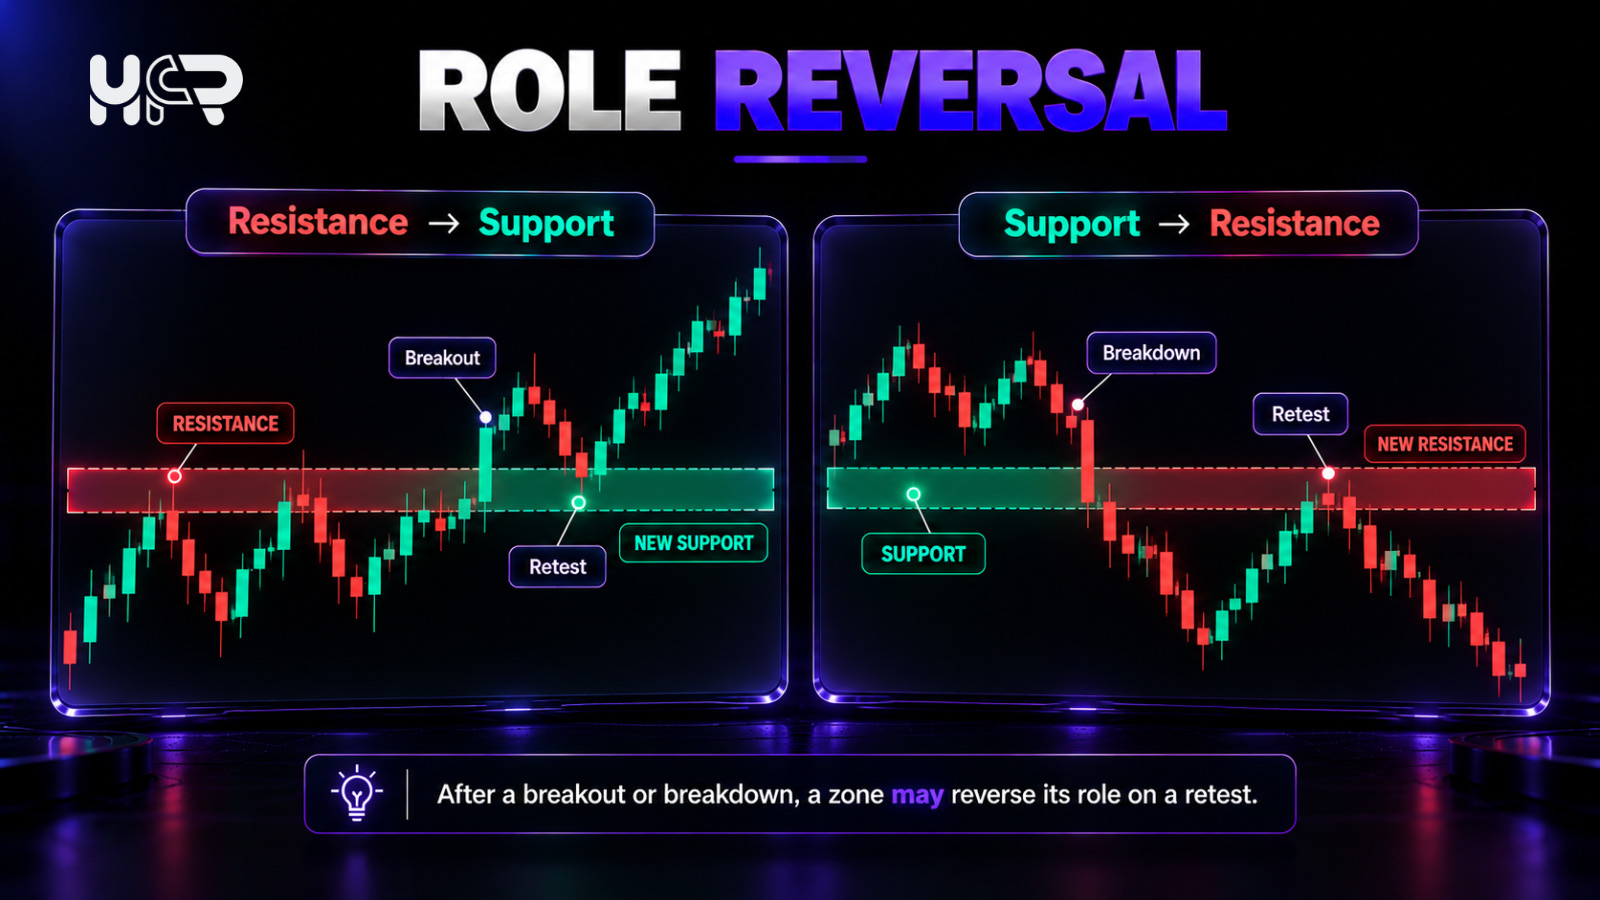
A breakout occurs when price moves beyond a former support or resistance area. A move below support places price beneath the earlier reaction zone; a move above resistance places it beyond the earlier ceiling. That change alone does not guarantee that price will continue in the same direction.
Context matters. A brief intraday move outside a zone can reverse quickly. A completed candle close beyond the area, followed by further trading outside it, provides different evidence from a wick alone. Use the same timeframe when assessing the break; even a sustained move can fail. See HFR’s forex order types guide for the difference between price conditions and order execution.
What is a false breakout?
A false breakout (or fakeout) happens when price moves beyond an identified support or resistance area but soon returns inside the earlier range. The break may appear convincing while a candle is forming, then fail before or after it closes.
Why a wick beyond a zone is not always a confirmed break
A candle wick records a temporary price extreme. If it extends beyond a zone but the candle closes back inside, the chart does not show a completed close beyond that boundary. A close outside a zone is still not proof that the next candle will continue in the same direction.
To read candle bodies, wicks and completed closes, see HFR’s forex candlestick guide.
Can old support become resistance?
Yes, a broken support or resistance area can later reverse its role. If price moves below support and later rallies back toward the same area, the former support can act as resistance. If price moves above resistance and later pulls back, the former resistance can act as support. This behaviour is often called role reversal.
Role reversal is a widely taught technical-analysis concept, but it is not a rule that every broken level must follow. A broken zone may never be retested, may be retested without holding, or may lose relevance as market conditions change.
What support and resistance can - and cannot - tell you
Support and resistance can help show | They cannot tell you by themselves |
|---|---|
Where price reacted before | Where price will definitely reverse |
Areas currently being tested | Whether a breakout will succeed |
How current price relates to past turning areas | Exact future direction |
Broad chart structure on a chosen timeframe | Whether a trade will be profitable |
Support and resistance are interpretive chart tools. Fidelity describes these areas as useful technical references while noting that technical analysis is not an exact science. A marked line or zone should not be treated as a forecast.
Why can two traders mark different support and resistance levels?
Support and resistance involve judgement. Analysts can choose different timeframes, historical windows, zone widths and chart feeds, so their marked levels may differ. A drawn level is also distinct from an executable Bid or Ask price; HFR’s forex slippage guide explains why actual fills can differ from chart prices.
Compare the marked area with the underlying chart: does it have a clear historical basis, and are the timeframe and the chosen zone width stated? Differences between analysts are easier to understand when those assumptions are explicit.
For examples of dated, approximate reference zones, see HFR’s market analysis. Those levels describe a particular observation window, not live guarantees.
Common mistakes when marking support and resistance
Treating a zone as one exact price. Price can turn slightly above, below or through an earlier level.
Drawing too many levels. A crowded chart can make minor moves look important and obscure the main zones.
Using one touch as strong evidence. One reaction can matter, but repeated reactions provide clearer historical context.
Ignoring the timeframe. A level can look important on a five-minute chart but minor on a daily chart.
Assuming more tests guarantee a bounce. Repeated tests describe the past, not the next reaction.
Treating every wick through a zone as a breakout. A brief move beyond the area can reverse before the candle closes.
Assuming every breakout will continue. Price can return inside the prior range after moving beyond support or resistance.
Forcing role reversal after every break. A former support or resistance area may or may not matter when price returns.
Turning a chart level into a prediction. Support and resistance are reference areas, not guaranteed future outcomes.
Checklist: reviewing a support or resistance zone
What currency pair and timeframe am I analysing?
Where are the clearest recent swing highs and swing lows?
Has price reacted in the same general area more than once?
Should the area be marked as a zone rather than one exact price?
Is the zone still relevant to the current price?
Does a broader timeframe show a similar reaction area?
Has price only tested the zone, or moved and held beyond it?
Could the apparent breakout be temporary?
Has a broken zone later been retested from the other side?
Am I describing chart context rather than predicting the next move?
FAQ
What is support in forex?
Support is a price area where a decline previously slowed, stopped, or reversed. It is a historical chart reference, not a guarantee that price will rise there again.
What is resistance in forex?
Resistance is a price area where an advance previously slowed, stopped, or reversed. It shows past price behaviour rather than a certain future ceiling.
Is support and resistance a line or a zone?
A line can be a useful visual shortcut, but major support and resistance are usually better treated as zones because price rarely reverses at exactly the same number each time.
How many times should price test a level?
There is no universal minimum number. Repeated reactions can make an area more historically prominent on the chart, but they do not guarantee the next test will hold.
Which timeframe is best for support and resistance?
There is no single best timeframe. The relevant timeframe depends on the analysis being performed. Higher timeframes provide broader context, while lower timeframes show more short-term detail.
What is a false breakout?
A false breakout occurs when price moves beyond support or resistance but does not stay beyond it and soon returns across the area.
Can support become resistance?
Yes. Former support can later act as resistance after a downside break, and former resistance can later act as support after an upside break. This is called role reversal, but it is not guaranteed.
Why do traders mark different support and resistance levels?
They may use different timeframes, zone widths, historical windows, or chart feeds. The process involves judgement rather than one universal calculation.
Are support and resistance levels reliable?
They can organise historical price behaviour and chart context, but no zone is guaranteed to hold, break, or predict future direction.
Final words
Support and resistance identify areas where price has reacted before. Mark clear zones, use a consistent timeframe, and assess both the move beyond a zone and what happens afterwards. Historical reactions help describe the chart; they do not establish what price will do next.
A useful level has a clear historical basis and an explained timeframe. It becomes misleading when an approximate price area is presented as a guaranteed reversal, breakout, or execution level.
Risk warning and disclaimer
Forex and CFD trading involve risk of loss, particularly when leverage is used. Support and resistance zones can fail, false breakouts can occur, and volatility, spreads, gaps, and execution conditions can change how price behaves around a chart area. A technical level should not be treated as a guaranteed reversal, breakout, or execution price.
This article is for educational and informational purposes only. It should not be treated as financial advice, investment advice, trading advice, or a recommendation to use any broker, exchange, digital asset, or derivative.
Sources and methodology
This beginner guide explains horizontal support and resistance using hypothetical examples rather than live trading levels. Its technical definitions were reviewed against IG Academy, Fidelity and OANDA educational material on 12 November 2026. Chart feeds, sessions and the timeframe selected can change the areas that appear on a particular chart.