






Table of Contents
[ Show/Hide ]- • What information does a forex candlestick show?
- • How to read the candle body and wicks
- • What do bullish and bearish candles mean?
- • How timeframe changes a forex candle
- • What a forex candle can and cannot tell you
- • How candlestick patterns add context
- • How to read a candle in a real forex chart
- • Common mistakes when reading forex candlesticks
- • A simple checklist for reading a forex candle
- • Final words
- • FAQ
- • Sources and methodology
- • Risk warning and disclaimer
A candlestick in forex is a visual summary of price movement during a specific period. Each candle records four values: the opening price, the highest price, the lowest price, and the closing price. Together, these are known as OHLC data.
Candlestick charts make it easier to see how price behaved without reading a long list of quotes. A trader can quickly compare where a period started, where it ended, and how far price moved in between.
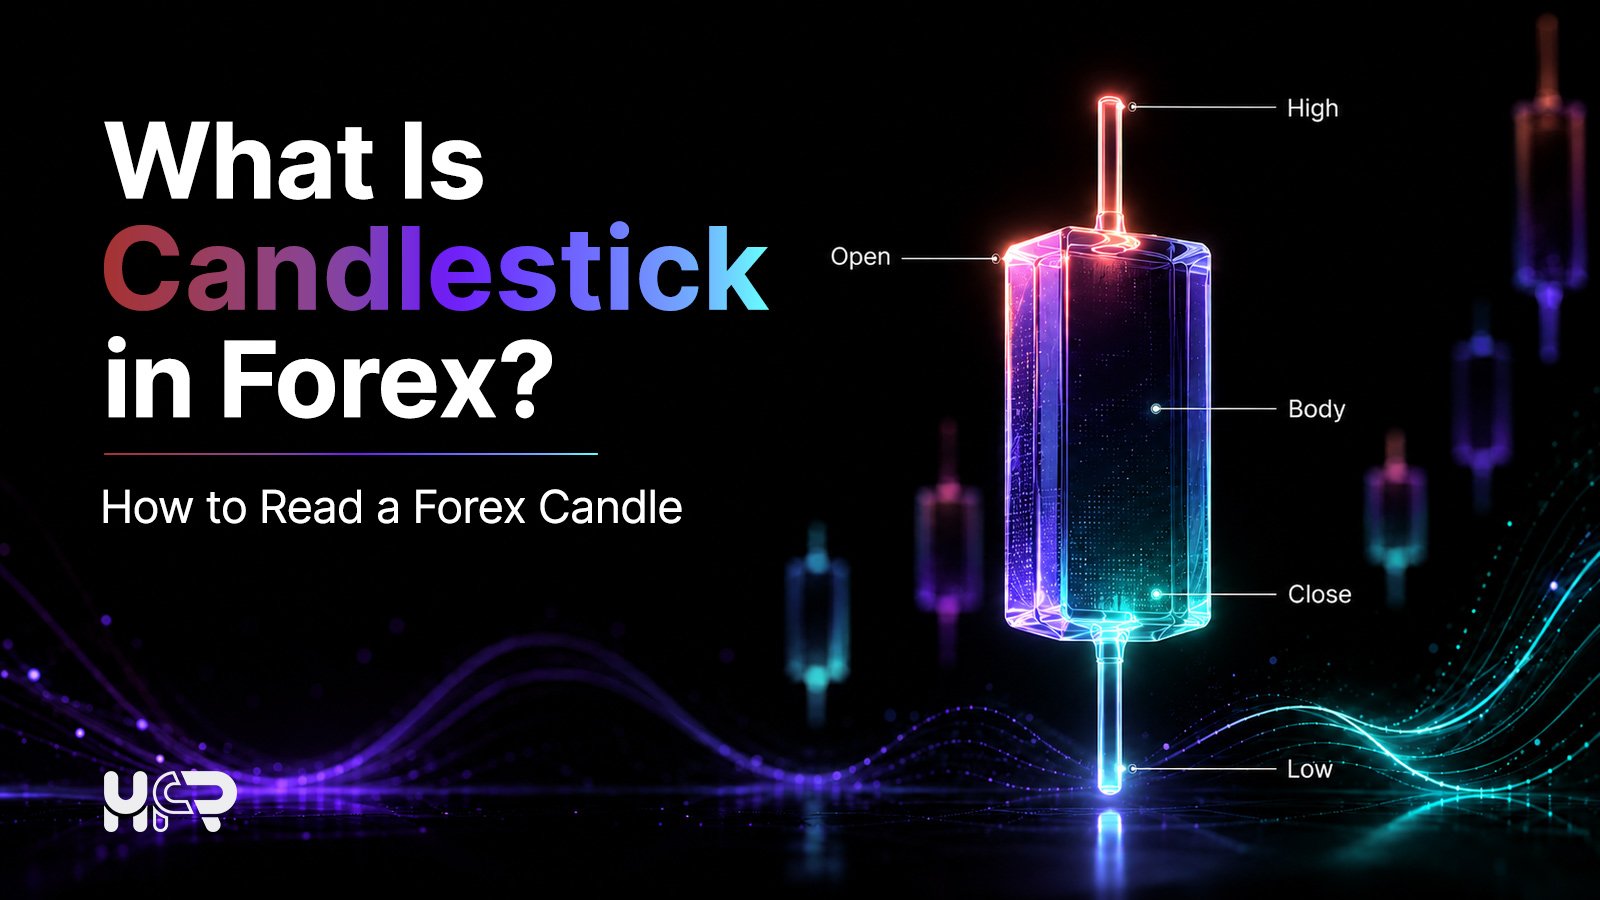
A candle does not explain why price moved, measure buyer or seller strength by itself, or predict what the next candle will do. A completed candle records historical price information; the current candle continues to change until its timeframe closes. Candles become more useful when read in the context of timeframe, market structure, volatility, and execution conditions.
What information does a forex candlestick show?
A forex candlestick represents price activity within the timeframe selected on the chart. On a one-hour chart, each candle represents one hour. On a four-hour chart, each candle represents four hours. A daily candle represents one chart-defined daily period. Its exact boundary can depend on the broker, data feed, platform, and server or session settings.
Every completed candle contains four main price points:
| Price point | Meaning |
|---|---|
| Open | The price at which the candle period started |
| High | The highest price reached during the period |
| Low | The lowest price reached during the period |
| Close | The price at which the candle period ended |
For example, imagine a one-hour EUR/USD candle with the following values:
- Open: 1.1000
- High: 1.1020
- Low: 1.0985
- Close: 1.1010
The candle shows that EUR/USD started the hour at 1.1000, traded as high as 1.1020 and as low as 1.0985, then finished the hour at 1.1010. The chart compresses all four values into one shape. OHLC shows the period's endpoints and price extremes, but it does not reveal the exact sequence of every price movement that occurred between the open and close.
How to read the candle body and wicks
A candlestick has two main visual components: the body and the wicks. Reading these parts correctly is the foundation of how to read candlesticks.
How the body shows the open-to-close move
The main rectangular part of the candle is the body. It shows the distance between the opening and closing prices.
If the close is above the open, the candle is bullish. If the close is below the open, the candle is bearish. Chart colours vary by platform, so the open and close matter more than whether a candle is displayed in green, red, white, or another colour.
A larger body means the distance between the open and close was larger during that period. It does not automatically mean that the broader trend is strong or that the same direction will continue.
How wicks show the high and low
The thin lines above and below the body are called wicks, shadows, or tails. They show the price extremes reached during the candle period.
- An upper wick shows that price traded above the body before the period ended.
- A lower wick shows that price traded below the body before the period ended.
A long wick is sometimes interpreted as price rejection when it appears in a relevant market context. However, the wick itself only confirms that price reached an extreme and later closed away from it. It is not a standalone reversal signal.
What do bullish and bearish candles mean?
Bullish and bearish labels describe whether the candle closed above or below its opening price. They are useful shorthand, but they should not be treated as direct measurements of order flow or buyer and seller strength.
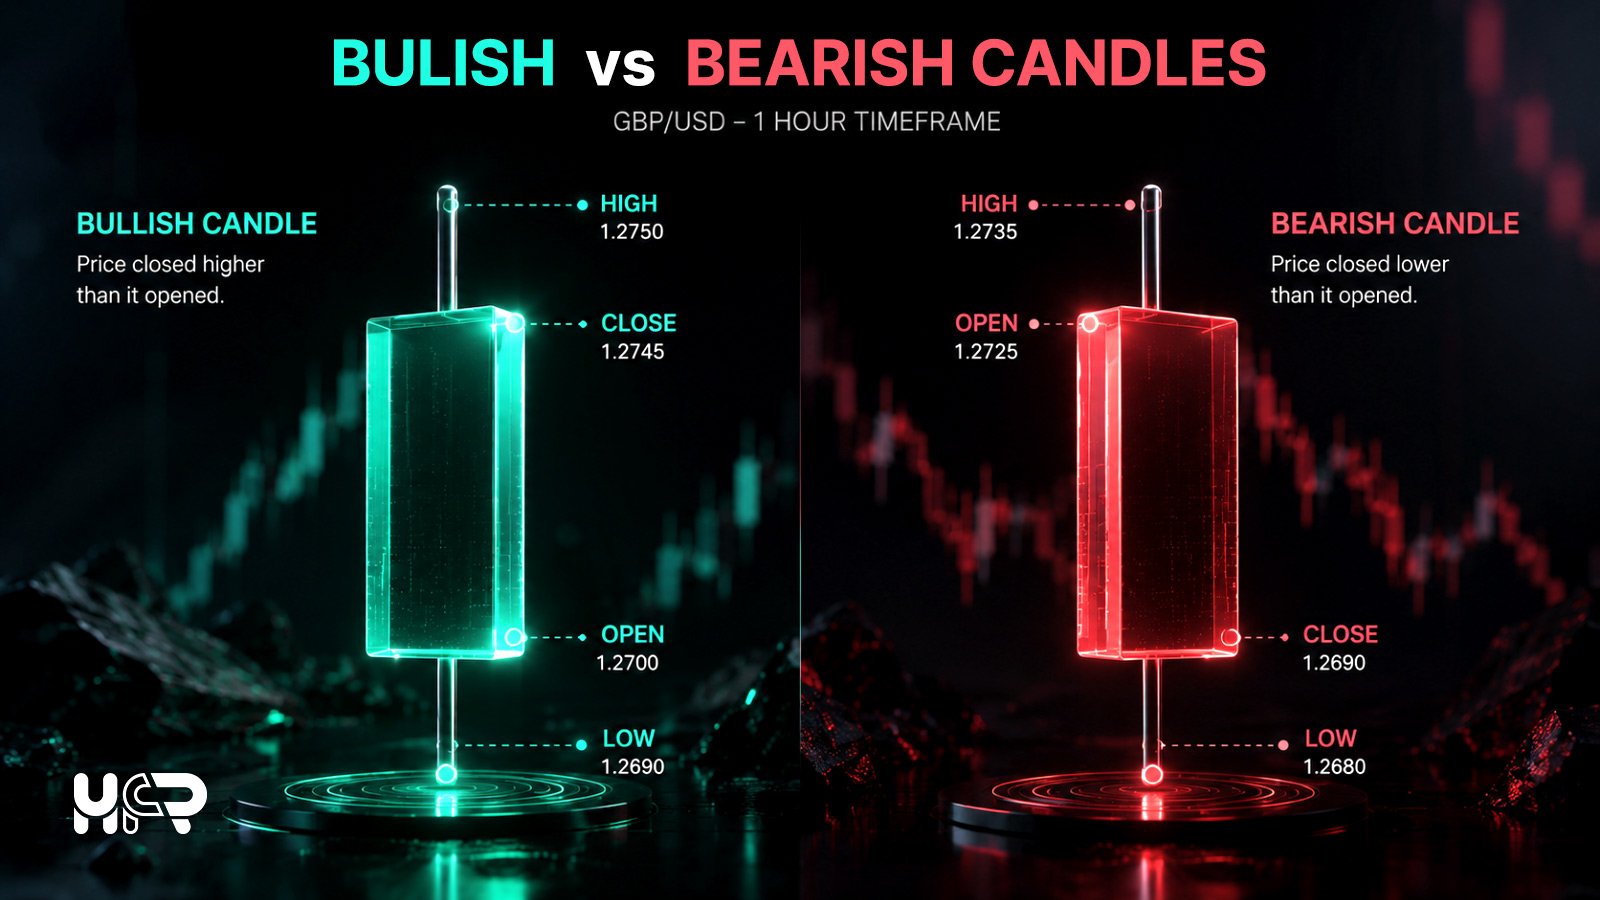
Bullish candle example
Suppose a one-hour GBP/USD candle has these values:
- Open: 1.2700
- High: 1.2740
- Low: 1.2685
- Close: 1.2725
Because 1.2725 is above 1.2700, the candle is bullish. Price ended the hour higher than where it started. That describes the result of the period; it does not guarantee that the next candle will also close higher.
Bearish candle example
Now suppose the next one-hour GBP/USD candle has these values:
- Open: 1.2725
- High: 1.2735
- Low: 1.2680
- Close: 1.2690
Because the close is below the open, the candle is bearish. Price ended the period lower than where it started.
How timeframe changes a forex candle
The same market can look very different on a one-minute chart and a daily chart. A move that appears large on a short timeframe may be minor when viewed across several days.
| Timeframe | What each candle represents |
|---|---|
| 1 minute | One minute of price movement |
| 1 hour | One hour of price movement |
| 4 hours | Four hours of price movement |
| Daily | One chart-defined daily period |
| Weekly | One chart-defined weekly period |
In forex, daily candle boundaries can differ slightly between brokers or platforms because server time and session settings are not always identical. As a result, the exact shape of a daily candle may vary even when both charts track the same currency pair.
Why an open candle can still change
A candle is not final until its timeframe closes. A one-hour candle that currently looks bullish can become bearish before the hour ends if price falls below the opening price. Its high and low can also expand while the candle remains open.
Until the timeframe closes, the candle's OHLC values are provisional.
What a forex candle can and cannot tell you
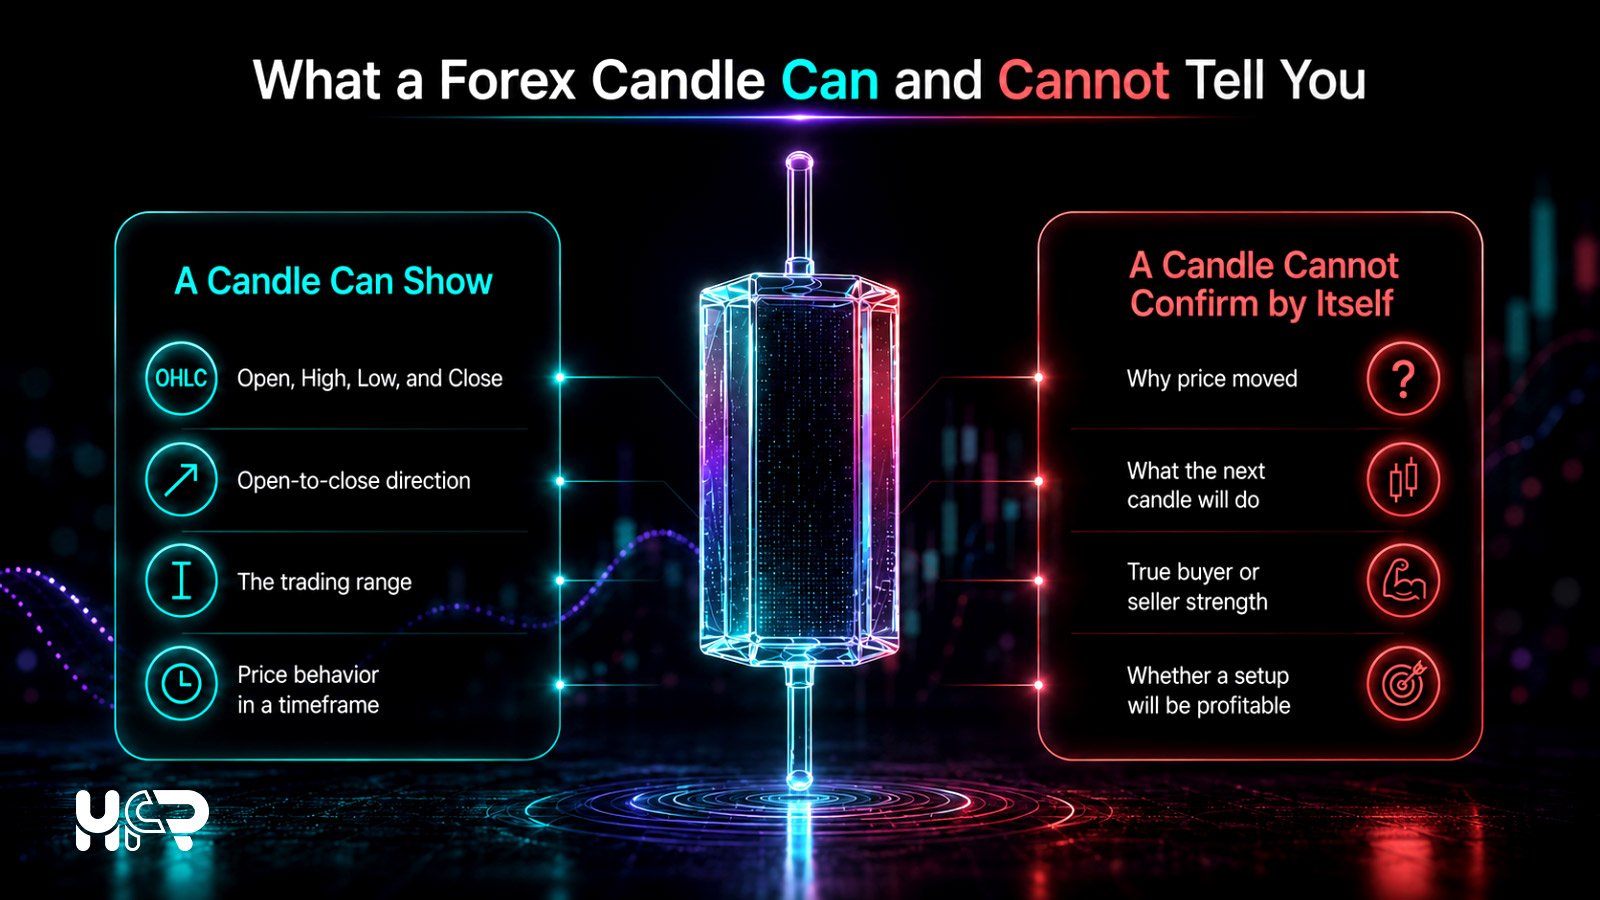
Candles are useful because they organize price information efficiently, but they have clear limits. Knowing those limits helps prevent overinterpreting a chart.
| A candle can show | A candle cannot confirm by itself |
|---|---|
| Open, high, low, and close | Why the price moved |
| Whether the period closed above or below the open | What the next candle will do |
| The trading range during the period | Participant intent or full order flow |
| How price behaved within a chosen timeframe | Whether a setup will be profitable |
For example, a long lower wick shows that price traded lower and later closed above that low. To understand whether that move matters, a user may also look at the broader trend, nearby support or resistance, volatility, economic events, and how price behaves after the candle closes.
How candlestick patterns add context
Some traders study repeated structures such as doji, hammer, and engulfing patterns. A doji closes near its open; a hammer-shaped candle has a relatively small body and long lower wick; and an engulfing pattern uses two candles, with the second real body covering the previous body.
Pattern names are interpretations of one or more OHLC candles, not additional market information. Their usefulness depends on the surrounding chart context, and none guarantees a reversal or continuation.
How to read a candle in a real forex chart
On a EUR/USD chart, candlesticks help users see where price accelerated, where the trading range widened, and where price repeatedly reacted. They are often reviewed alongside support and resistance, market structure, economic events, and technical indicators.
Some platforms also display tick volume or, where the data feed provides it, real trade volume. Spot FX is an over-the-counter (OTC), decentralised market, so there is no single consolidated global volume figure covering all spot FX activity. Chart price and execution price should also be kept separate. MetaTrader 5 states that OTC charts are based on Bid prices, while trades may involve the Bid or Ask depending on the order direction. This is one reason an execution price may not line up exactly with the visible candle.
For the execution side of this difference, HFR's guide to forex slippage explains why an order can fill at a different price from the one expected.
Common mistakes when reading forex candlesticks
- Treating one candle as a prediction
A single candle records what happened during one period. It does not determine the next move. Economic releases, liquidity changes, spreads, volatility, and new orders can change price quickly.
- Reading an unfinished candle as final
The shape of the current candle can change until the timeframe ends. Confirm whether the candle has closed before treating its OHLC values as final.
- Ignoring the timeframe
A candle that looks dramatic on a one-minute chart may be routine on a four-hour or daily chart. Always check the timeframe before drawing conclusions from body or wick size.
- Assuming colour equals market strength
A bullish candle only means close above open, and a bearish candle means close below open. Candle colour alone does not measure the strength of buying or selling or define the broader trend.
- Ignoring broker and platform differences
Time zones, session settings, spreads, and quote feeds can create small differences between charts. This matters especially when comparing daily candles across brokers.
A simple checklist for reading a forex candle
Before interpreting a candle, work through the basic information first:
- What currency pair and timeframe am I looking at?
- Has the candle closed, or is it still forming?
- Where are the open and close?
- What are the high and low?
- How large is the body relative to nearby candles?
- Are the upper or lower wicks unusually long?
- Is the candle near a relevant support, resistance, or recent price area?
- Could volatility, economic news, or execution conditions be affecting the chart?
This process keeps the focus on observable information before moving into interpretation.
Final words
A forex candlestick is a compact way to read price movement. The body shows the relationship between the open and close, while the wicks show the high and low reached during the selected timeframe.
The most useful habit for beginners is to separate observation from interpretation. A candle can show what price did, but it cannot by itself explain why the move happened or predict what comes next.
To continue from chart reading into execution and account risk, read HFR's Margin Call vs Stop Out.
FAQ
What does a candlestick represent in forex?
A forex candlestick represents the open, high, low, and close for a specific timeframe. It is a visual summary of price movement during that period.
What is the difference between a candle body and a wick?
The body connects the opening and closing prices. The wicks extend to the highest and lowest prices reached during the period.
Is a green candle always bullish?
On platforms where green represents upward candles, green usually means the close is above the open. Color settings can be changed, so the open and close are the reliable reference points.
Why can daily forex candles look different between brokers?
Brokers and platforms may use different server times or session boundaries. That can change where one daily candle ends and the next begins.
Are candlestick patterns reliable?
Candlestick patterns can help describe how price behaved, but they do not guarantee future direction. Their interpretation depends on the timeframe, surrounding price structure, volatility, and what happens after the pattern forms. A pattern should therefore be treated as chart information rather than a certain trading signal.
Can candlesticks be used for crypto markets?
Yes. Crypto, stocks, commodities, and other markets also use candlestick charts. The same OHLC structure applies, although market hours, liquidity, and execution conditions differ.
What does OHLC mean in forex?
OHLC stands for Open, High, Low, and Close. These are the four price values used to build a candlestick. The open and close form the candle body, while the high and low define the full price range and the ends of the wicks.
Why can my trade price differ from the candlestick chart?
The displayed chart and the price used for an order are not always the same thing. MetaTrader 5 states that OTC charts are based on Bid prices, while the Bid or Ask can apply depending on the trade direction. Spread, market movement, and slippage can also affect the execution price.
Sources and methodology
This article is a desk-based beginner guide to forex candlesticks and chart construction. Core chart mechanics were checked on 29 August 2026 against current MetaTrader 5 price-data documentation and Bank for International Settlements material on the structure of the global FX market. Platform chart construction, price feeds, and session boundaries can vary, so the relevant broker or platform documentation remains the final reference for a specific chart.
Sources checked:
- MetaTrader 5 - Price Data
- BIS - The FX trade execution landscape through the prism of the 2025 Triennial Survey
- HighFxRebates - Forex Slippage Explained
- HighFxRebates - Margin Call vs Stop Out
Risk warning and disclaimer
Forex and CFD trading involve risk of loss, particularly when leverage is used. Candlestick charts describe price behaviour but do not guarantee future market direction or profitable results.
This article is for educational and informational purposes only. It should not be treated as financial advice, investment advice, trading advice, or a recommendation to use any broker, exchange, digital asset, or derivative.
 6
6
Share Posts


Further Reading
- Why Did My Stop Loss Trigger When Price Never Reached It?
- Why the Same Forex Broker Can Have Different Legal Entities
- U.S. Jobs Slow, the Dollar Firms & Bitcoin Advances While Rate Expectations Shift — September 28-October 4, 2026
- Bitcoin, Ethereum, Solana, Gold and Silver Technical Outlook: Key Daily Zones After a Mixed Macro Week — October 5, 2026